How to Measure Affiliate Marketing Performance
Written by Edward Cranmer on 24 minute read
The metrics that matter, how to see every partner in the customer journey, and how to tell which ones bring sales you wouldn't otherwise get.
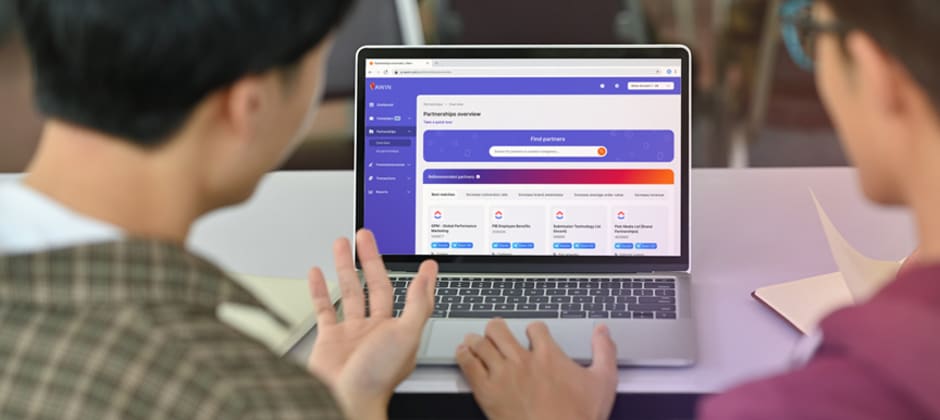
Your partners are driving sales. Behind those sales sits a layer of insight that’s easy to miss, and it can help you grow your programme further.
With the right measurement, you can see how much value each partner contributes, how your results compare with your industry, and how affiliate stacks up against your other channels when budgets are set.
Measuring affiliate marketing performance means tracking the sales, revenue and costs your partners drive, then putting those numbers in context with benchmarks, customer journey data and incrementality. Together they show the value each partner adds, so you can put budget where it earns the most.
This guide works through it step by step, from the core metrics to bringing affiliate data into the tools your team already uses, with Awin’s reports as worked examples along the way.
The affiliate marketing metrics that matter
Start with your goal. A brand chasing new customers needs different numbers from one focused on basket size or profit.
Affiliate metrics usually fall into four groups: traffic, conversion, profitability and programme health. The table below shows the key metrics in each group and how to work them out.
| Key metrics | What they tell you | How to work them out | |
|---|---|---|---|
| Traffic | Clicks, earnings per click (EPC) | How much interest partners create, and what each click is worth | EPC = commission ÷ clicks |
| Conversion | Sales, conversion rate, average order value (AOV) | How well partner traffic turns into orders | Conversion rate = sales ÷ clicks × 100 AOV = revenue ÷ sales |
| Profitability | Revenue, cost of sale, return on spend, new versus returning customers | Whether the channel pays for itself, and who it brings in | Cost of sale = commission ÷ revenue × 100 Return on spend = revenue ÷ (commission + fees) |
| Programme health | Active partners, reliance on top partners, reversal rate | How balanced and reliable your programme is | Reliance = top partner revenue ÷ total revenue × 100 Reversal rate = declined sales ÷ total sales × 100 |
To see how these formulas work in practice, we’ll use Fernway, a made up outdoor retailer that we’ll follow through the rest of this guide.
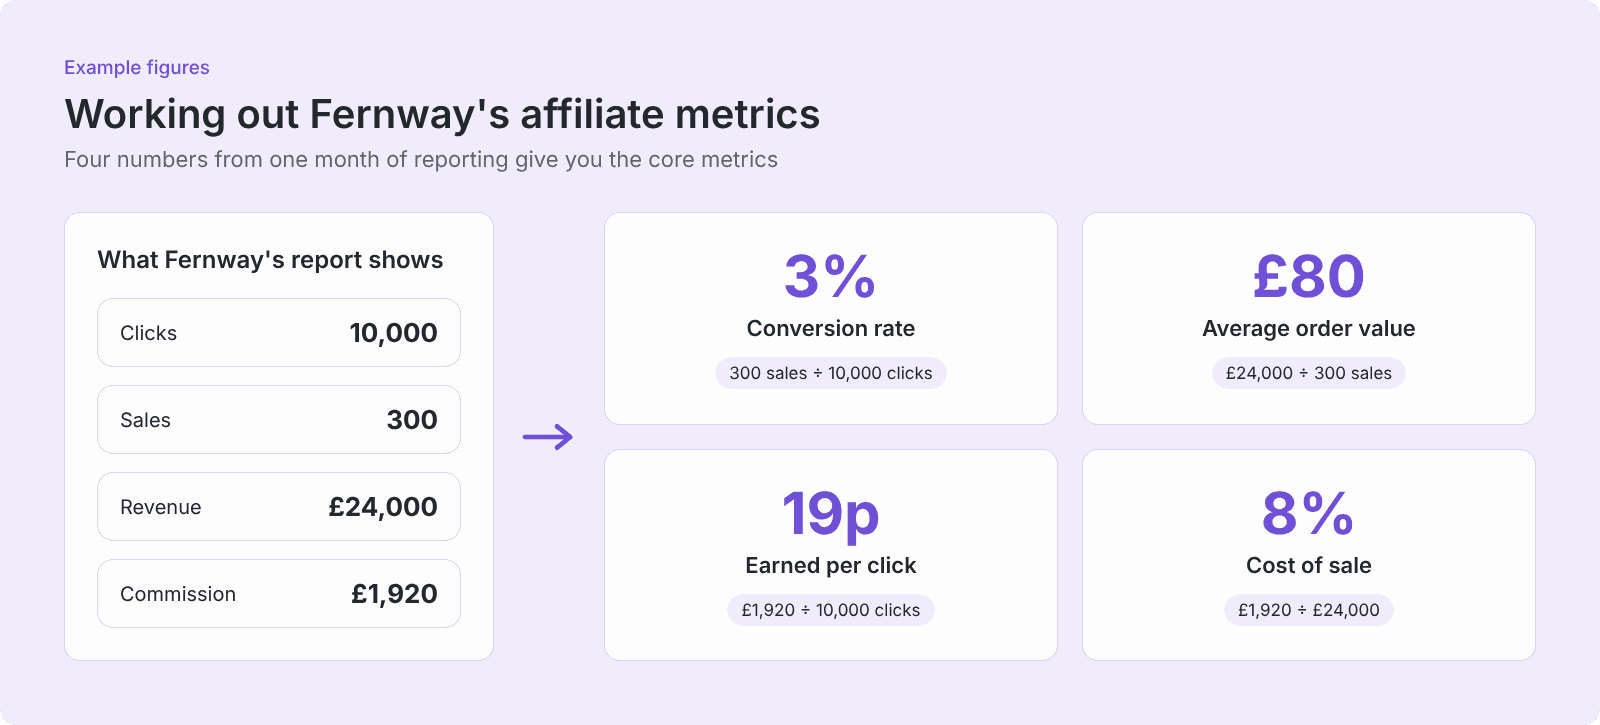
Read your metrics together. A high conversion rate with a low average order value can mean a partner is catching shoppers who were already about to buy. We cover how to check this under incrementality.
Compare new and returning customers to see whether partners are finding you new buyers.
Watch your reversal rate. A sudden rise can point to low quality traffic or affiliate fraud.
The 80/20 rule describes a common pattern, where a small group of partners drives a large share of sales. Tracking how much revenue comes from your top partners shows when to spread the risk and recruit more widely.
How to read your affiliate reports
Affiliate reports hold a lot of data, and it’s easy to look at the totals without learning much. A simple routine helps you check the right things at the right time.
- During campaigns: compare sales with the same period last week. A sudden drop can mean a broken link or a partner’s placement coming down, and spotting it early limits the sales you lose.
- Weekly: look at which partners rose or fell. A jump often follows a new feature or offer, while a fall can mean an expired voucher code or a lost spot on a partner’s site.
- Monthly: check cost of sale, new versus returning customers and reversals. Together they show the value partners bring for the commission you pay.
- Quarterly: review your partner mix and how much you rely on your top partners, then compare review your partner mix, then compare
When a number moves, work down from the total: first the partner, then the campaign, then the product or device. That route usually leads you to the cause in a few clicks.
Checking performance in Awin
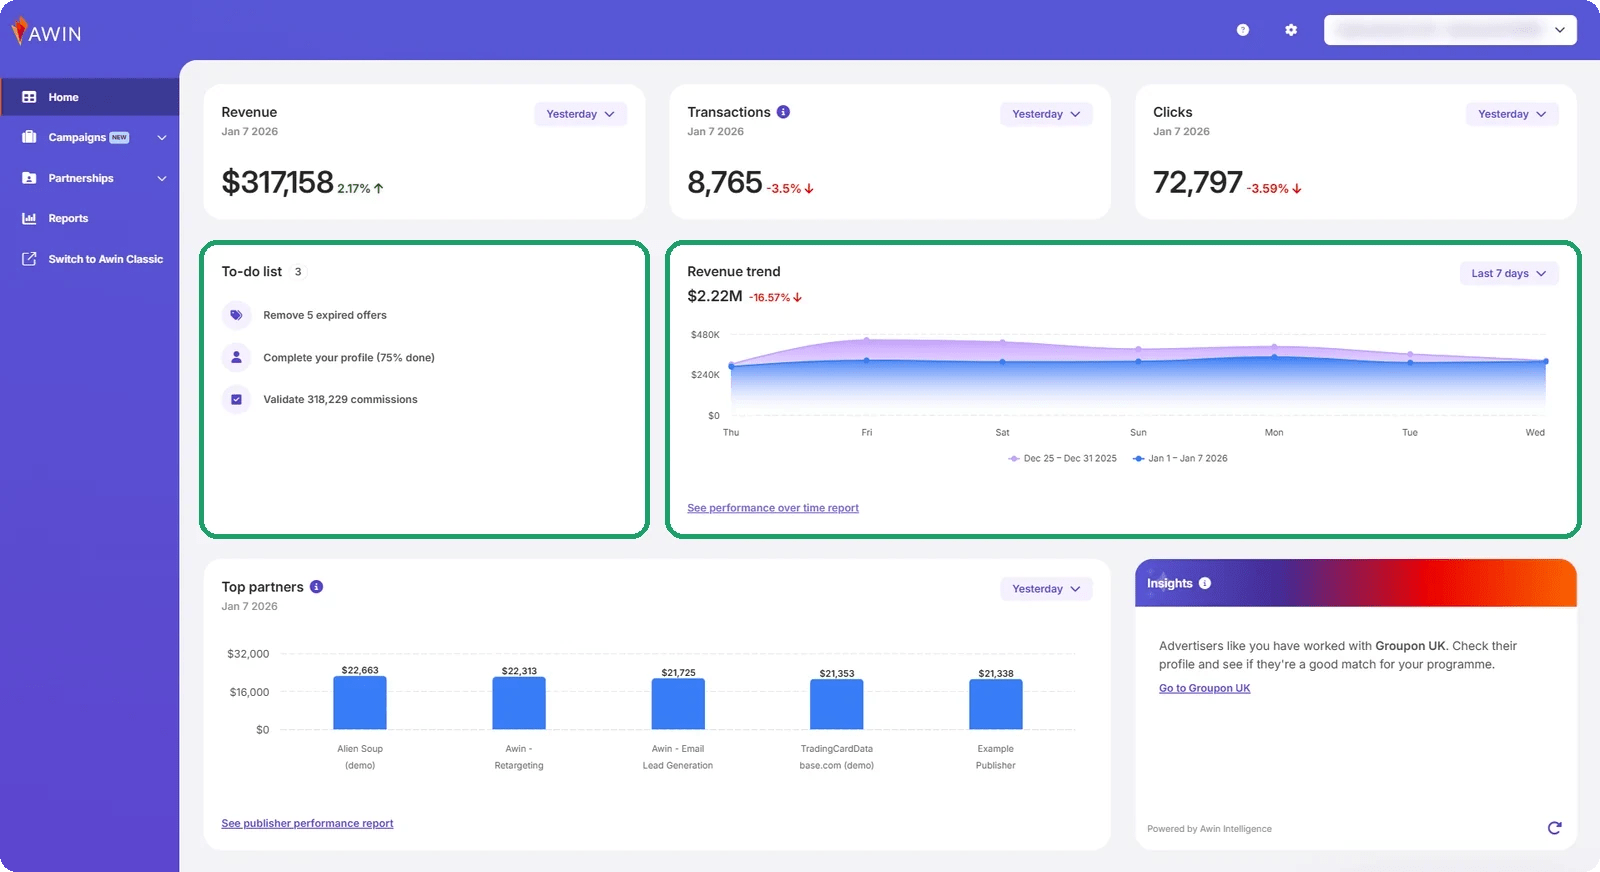
Every Awin plan includes campaign performance reporting, and on the new Awin platform it runs in real time. Reports depend on accurate tracking, so it’s worth checking your affiliate tracking is set up properly.
Real time data means Fernway can check its weekend boot sale by Saturday lunchtime. A cashback site is driving strong sales, so Fernway asks about a homepage feature for Sunday while the sale is still live.
Your dashboard adds a revenue trend and a to-do list of suggested next steps alongside the numbers.
Custom reports for the questions standard reports miss
Standard reports are organised around partners and campaigns. Your business may think in other terms, such as product category, margin or creative. Custom reports shape the data to match how you work.
Fernway’s tents carry a better margin than its boots. To decide whether tent sales deserve a higher commission, the team needs to see which partners sell tents, and how often. The Product report is the place to start.
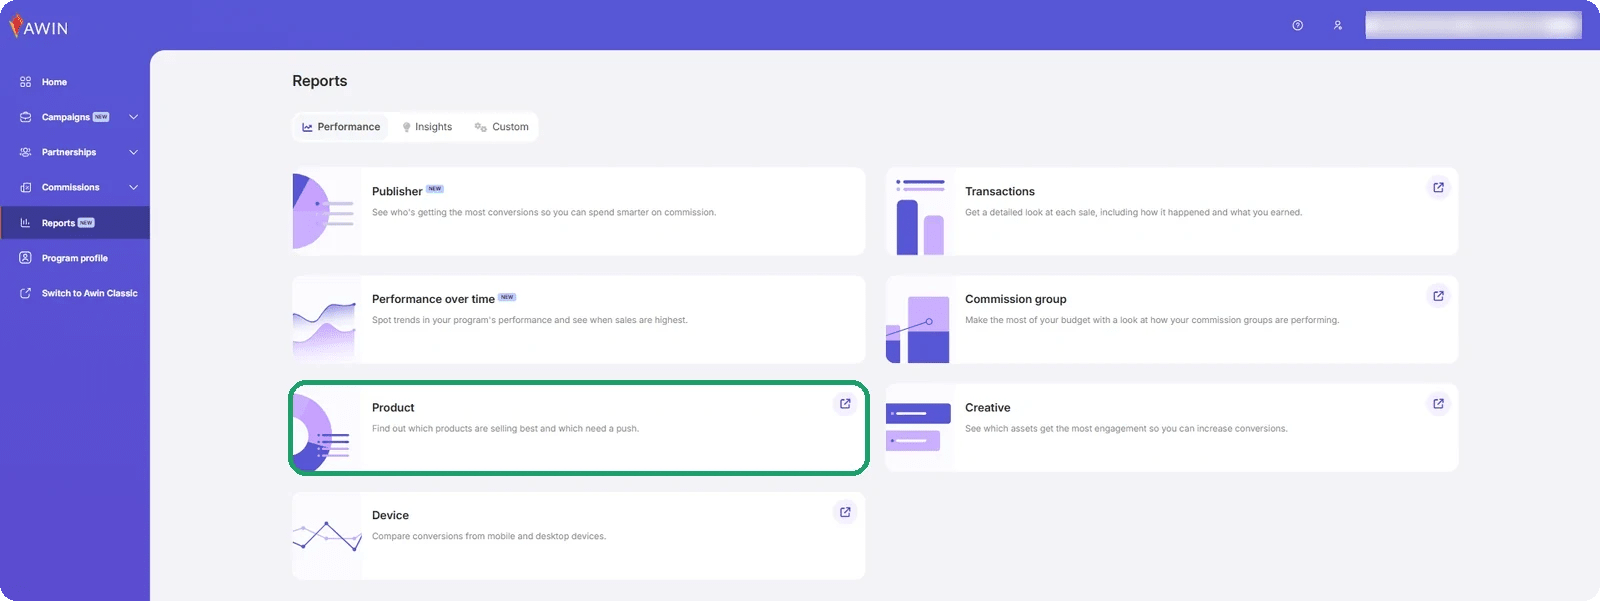
When a standard report can’t answer the question, a custom report can. In Awin, custom reports sit in their own tab under Reports.
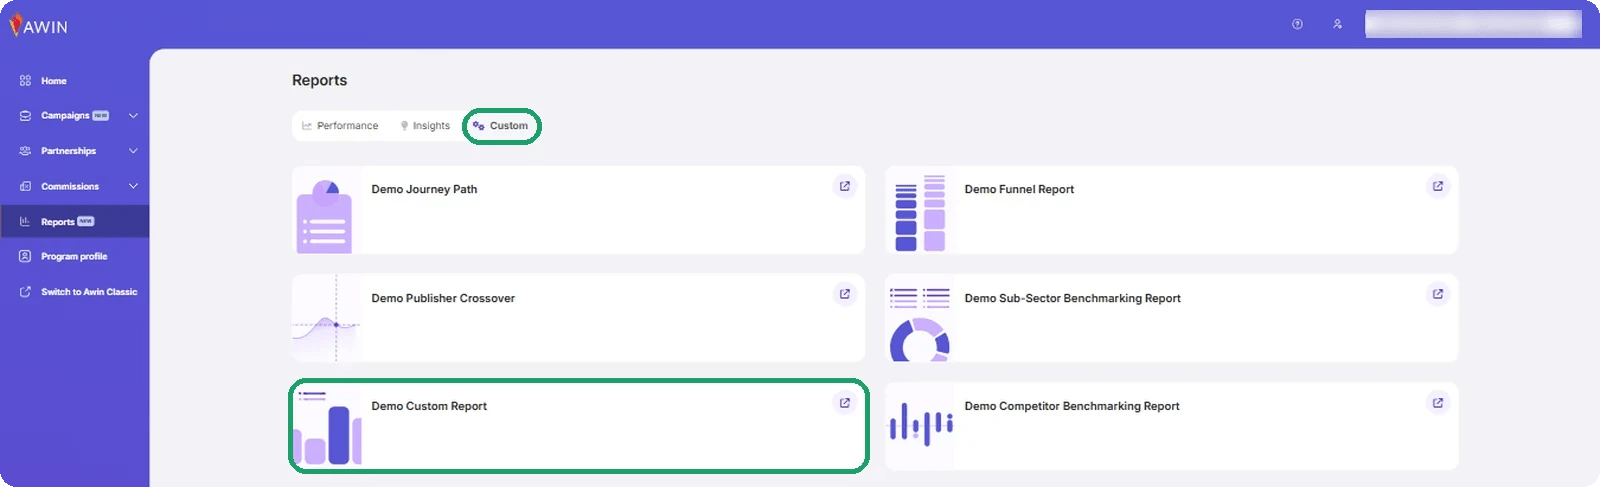
How far you can customise depends on your plan:
| What it gives you | Plan | |
|---|---|---|
| Performance reporting | Campaign results across sales, revenue and commission | Every plan |
| Enhanced reporting | Flexible customisation, with publisher, product and creative performance | Accelerate and Advanced |
| Custom reports | Reports built for your specific needs | Advanced |
-Source: Awin pricing
You can compare everything each plan includes on our pricing page.
Benchmarking your affiliate programme
A conversion rate or sales figure means little on its own. The same 3% conversion rate can be strong in one sector and weak in another, and a dip in January may simply be the whole market slowing after Christmas.
Benchmarks give your numbers that context. A few habits make them useful:
- Compare like with like: use the same sector, region and time period. A UK outdoor retailer learns little from comparing itself with global fashion brands.
- Watch the direction: benchmark data is usually indexed, which puts your performance and the market’s on a common scale without sharing anyone’s exact figures. What matters is whether you’re moving with the market or against it. Growth that trails your sector is still a warning sign.
- Look at the partner mix: the types of partners driving sales for similar brands show where you might be under invested.
- Look past a single month: one month’s comparison can mislead, especially around sales peaks like Black Friday. Trends across several months give a fairer picture.
Benchmarking in Awin
In Awin, benchmark reports sit under the Insights tab in Reports.
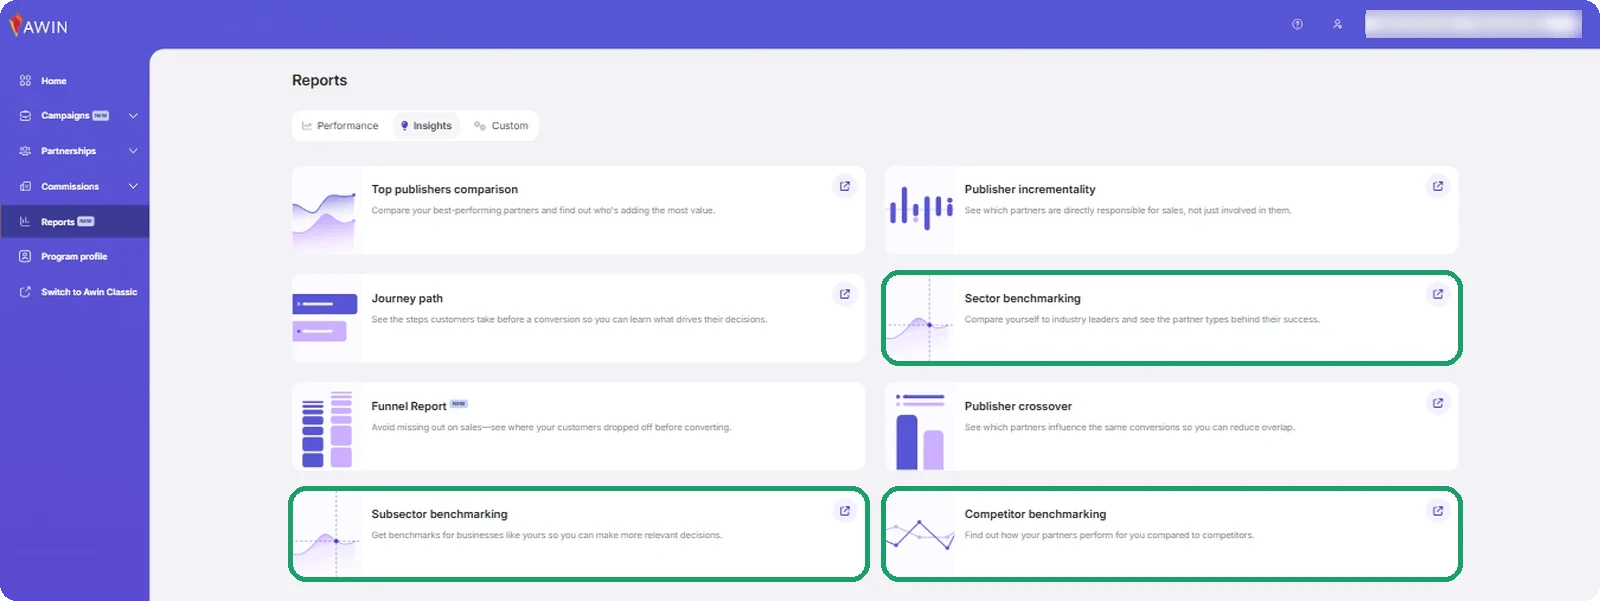
Each report goes a level deeper, and the deeper levels depend on your plan:
| What it compares | Plan | |
|---|---|---|
| Sector Benchmarking | Your programme against your sector in your region, across transactions, clicks, revenue and AOV, plus your mix of partner types | Accelerate and Advanced |
| Subsector Benchmarking | Your programme against a chosen subsector over time | Advanced, with the MasterTag |
| Competitor Benchmarking | Your programme against direct competitors, including market share, reliance on your top 20 partners and partner opportunities | Advanced |
-Source: Awin pricing and Awin help centre
Putting benchmarks to work
Say Fernway’s conversion rate drops in January and the team suspects a partner has stopped performing. If the Sector Benchmarking report shows the whole outdoor sector dipping by a similar amount, the drop is seasonal and there’s nothing to fix.
The Competitor Benchmarking report might raise a bigger question. If Fernway relies on its top 20 partners for more of its sales than competitors do, it’s exposed if one of them changes course. The gap analysis can then point to content partners that competitors work with and Fernway doesn’t, giving the team a recruitment list.
Used this way, benchmarks show whether a change needs action. You can see how each report works in the Competitor Benchmarking guide.
Seeing the full customer journey
Affiliate programmes most commonly pay commission on a last click basis. The partner whose link a shopper clicked last before buying gets the credit. It’s simple and predictable, and it hides the partners who did the early work.
Shoppers often visit more than once before buying. They might read a review, leave, compare prices a few days later, leave again, then come back through a voucher code and buy. Three partners sent that shopper to your site, and last click credits only the final one.
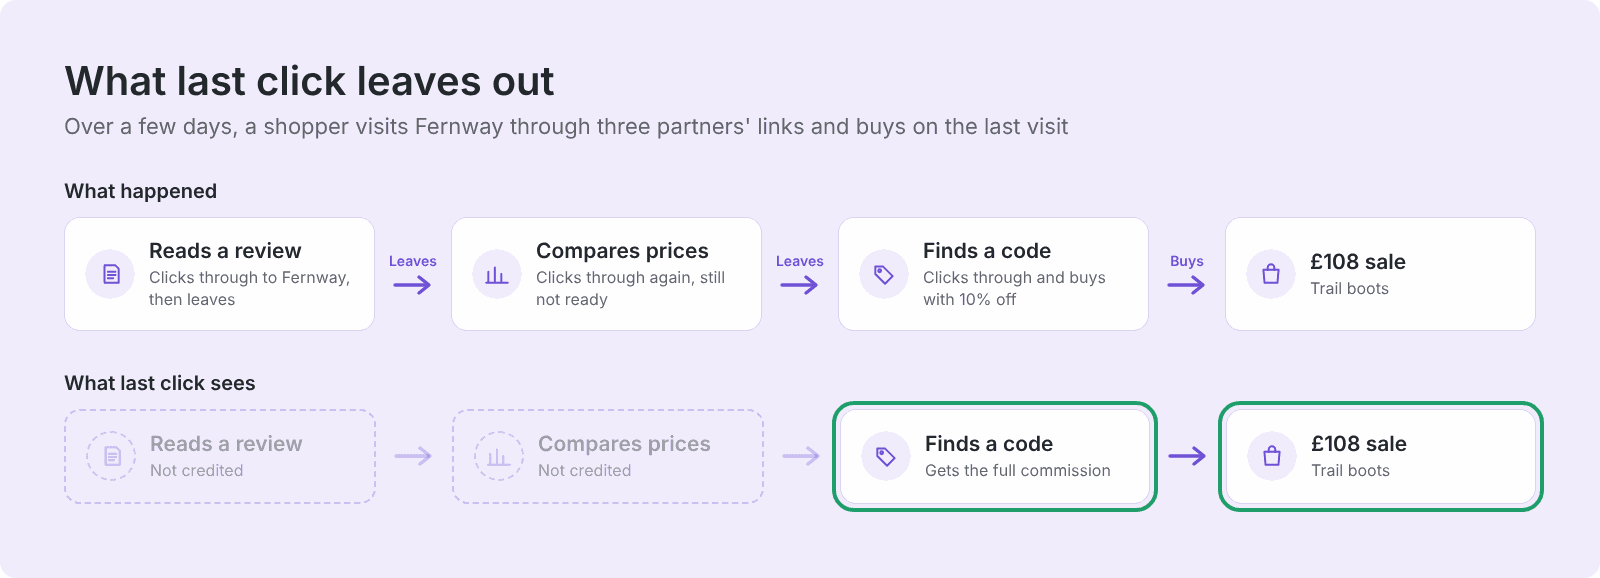
Seeing the whole journey improves how you handle:
- Commission: if you only see the partners who close sales, you’ll keep rewarding them and may cut the content partners who send shoppers their way.
- Recruitment: knowing which partners start journeys shows you where new customers come from.
- Budget: it shows the full value a partner adds, so you can make the case for keeping them.
Other ways to share the credit
Last click is one attribution model among several. First click gives the credit to the partner who started the journey, such as the review site in the example. Multi touch models split it across the partners involved, either evenly or with more weight on the first and last touch.
Each model suits different goals, and you can use journey data to adjust commission without leaving last click altogether. Our guide to attribution models explains each one in detail.
How Awin shows the journey
SingleView is Awin’s attribution technology. It’s an add-on that measures how partners and channels work together across each customer journey. It connects through the MasterTag, and it powers two reports:
| What it shows | Available with | |
|---|---|---|
| Journey Path report | Every touchpoint behind each sale, with journey length and the number of unique touches | Accelerate and Advanced, with SingleView |
| Attribution performance report | SingleView's insights in the Awin platform, organised by attribution, funnel and incrementality | SingleView |
-Source: Awin help centre
If Fernway checked Journey Path for its boot sales, it might find the review site appearing early in journeys that end with a voucher code. Under last click, that review site would look like a weak partner. Seeing its real role, Fernway could offer it a higher rate rather than cut it from the programme.
Journey Path also shows traffic from AI platforms, so you can see where AI assistants played a part before a sale. Our guide to AI search covers how to track that traffic.
Measuring incrementality
Incrementality is the extra value a partner brings that wouldn’t have happened without them. Attribution decides who gets credit for a sale. Incrementality asks whether the partner changed the outcome.
It shapes how you set commission. A shopper who finds a code at checkout may have bought anyway, while a review site bringing in first time buyers can get little credit under last click.
Measuring incrementality helps you:
- Put commission behind the partners who grow your sales
- Show finance that the channel brings in revenue you wouldn’t otherwise get
- Spot partners worth investing in before competitors do
- Agree commission rates with partners using evidence you can both see
How brands test for incrementality
There are three common approaches, and they carry different levels of risk.
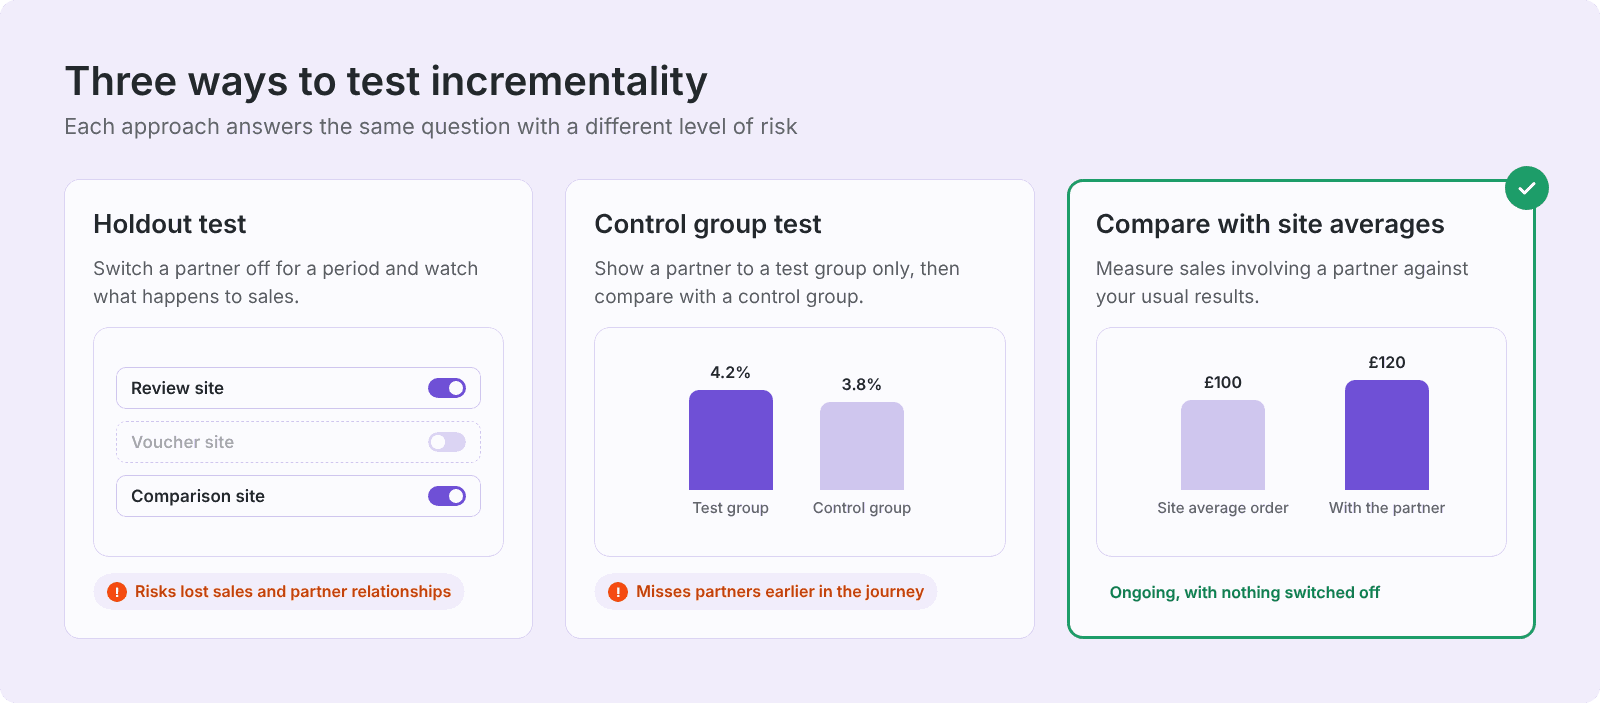
Whichever you choose, judge each partner against its role. Content and comparison sites help shoppers discover you. Voucher and cashback sites help them decide to buy. Loyalty programmes bring them back.
Use each data source for what it sees best. Judge affiliate partners on your network’s journey data, which records every affiliate click, and use GA4 for wider site behaviour. If you compare the two, match the attribution model and time window so the figures line up.
Measuring incrementality in Awin
The Publisher Incrementality report shows which partners are directly responsible for sales. It’s available on the Advanced plan, with the MasterTag enabled, and it measures three kinds of value: bigger baskets, more journeys started and higher conversion rates.
| What it measures | Example | |
|---|---|---|
| Basket Boost | How a partner's involvement affects order value, compared with your site average | Site AOV £100, partner involved AOV £120: a 20% Basket Boost |
| Initiator Ratio | How often a partner starts the journey to a sale | Involved in 100 sales, first touch in 10: a ratio of 0.1 |
| Conversion Impact | How a partner's involvement affects conversion rate, compared with your site average | Site conversion rate 5%, partner involved 7%: a 40% Conversion Impact |
-Source: Awin help centre
If Fernway’s review site showed a high Initiator Ratio, it would be starting journeys and bringing in shoppers who weren’t already looking. If the voucher site showed little Basket Boost and rarely started journeys, it would mostly be catching the final click. Fernway could then set commission to match each partner’s role.
Awin’s guide to understanding incrementality goes deeper into partner roles and testing.
Getting affiliate data into your own tools
Affiliate is one channel among several, and marketing teams often report on all of them together. When your affiliate data sits only inside your network’s platform, it’s harder to compare with paid search or email, and someone ends up copying figures into spreadsheets every week.
Bringing the data into the tools you already use solves that. Affiliate results sit beside your other channels, reports update without manual exports, and anyone on the team can get answers without logging into another platform.
The right route depends on who needs the data and how:
| Best for | On Awin | |
|---|---|---|
| APIs | Automating tasks and pulling transaction data or reports into your own systems | Accelerate and Advanced |
| BI tools | Dashboards that show affiliate beside your other channels | Third party connectors bring Awin data into tools such as Power BI and Looker Studio |
| AI assistants | Quick answers about live programme data, in plain English | The Awin MCP server, free and open source |
-Source: Awin pricing and Awin help centre
APIs and BI tools
An API lets your systems request data from your network automatically. Your developers, or a connector tool, can pull in transactions and reports on a schedule, so the figures are always current. Data access is one of the things to check when choosing an affiliate network.
If Fernway’s ecommerce team reports every channel in Looker Studio, a connector can pull in Awin data so affiliate revenue appears beside paid search and email in the same dashboard, with no weekly export. Awin’s API documentation explains what data is available.
Asking AI assistants about your data
The Awin MCP server connects AI assistants such as Claude or ChatGPT to your live Awin data. You ask a question in plain English, such as how your programme KPIs compare with last month, and get an answer without exporting data or building a pivot table.
It’s free, open source and read only, so it answers questions without making any changes to your account.
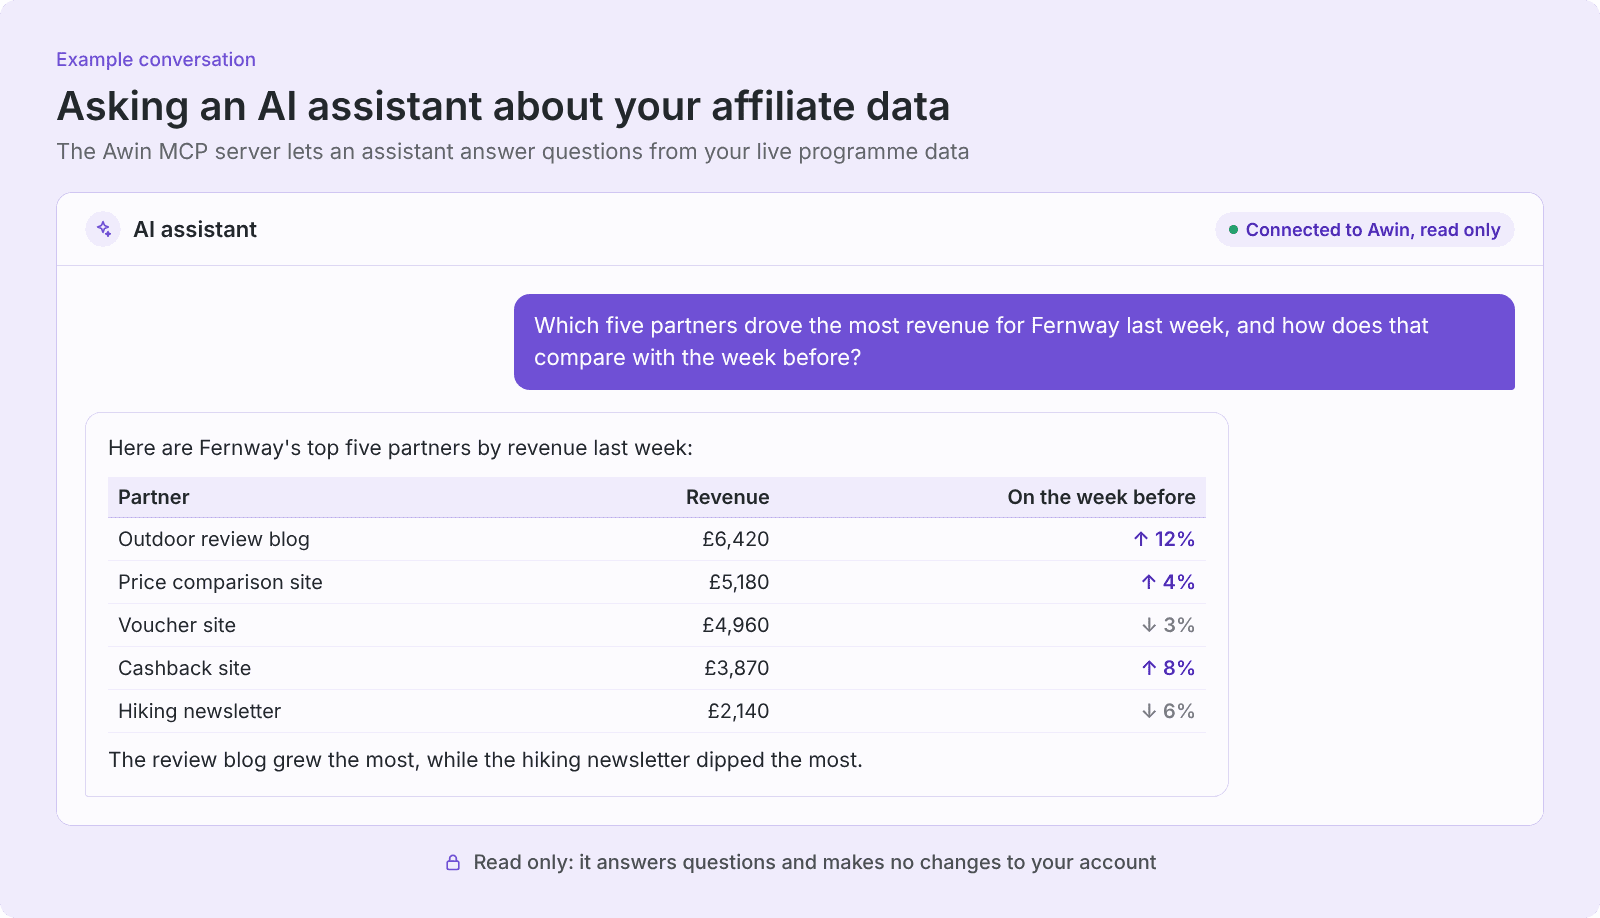
Our guide to AI in affiliate marketing covers how to connect your data to an AI assistant.
FAQs on measuring affiliate marketing performance
What metrics should I track for affiliate marketing?
Track metrics across four areas: traffic (clicks and earnings per click), conversion (conversion rate and average order value), profitability (cost of sale, return on spend and new customers) and programme health (active partners, reliance on top partners and reversals). Choose the ones that match your goal, whether that’s growth, basket size or profit.
What is the 80/20 rule in affiliate marketing?
The 80/20 rule describes a common pattern where a small share of partners drives a large share of a programme’s sales. Strong top partners are valuable, and leaning on too few leaves you exposed if one changes strategy. Tracking revenue from your top partners shows when to recruit more widely.
How do you measure incrementality in affiliate marketing?
Measure incrementality by comparing sales involving a partner with your usual results, such as order value and conversion rate, and by checking how often that partner starts journeys. Holdout tests, which switch partners off for a period, are another option and carry a risk of lost sales and strained relationships.
Can I connect affiliate data to Power BI or Looker Studio?
Yes. Affiliate data can flow into Power BI, Looker Studio and other BI tools through your network’s API and third party connectors. On Awin, APIs are available on Accelerate and Advanced, and connectors bring Awin data into these dashboards so affiliate results sit beside your other channels.
Does Awin offer industry benchmarks?
Yes. Awin’s Sector Benchmarking report compares your programme with your sector on Accelerate and Advanced. Advanced adds the Subsector Benchmarking report, with the MasterTag, and the Competitor Benchmarking report, which compares you with direct competitors on market share, reliance on top partners and partner opportunities.
Ready to see what your partners really drive?