Affiliate marketing growth accelerates as advertisers plough £1.6bn into performance channels
Written by Kevin Edwards on 4 minute read
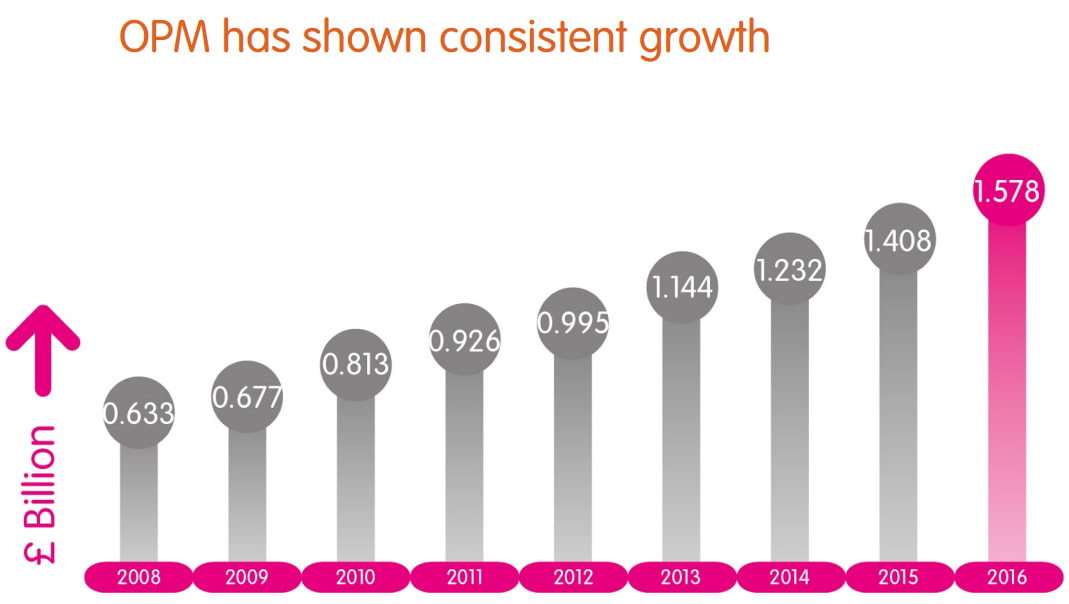
The online performance marketing industry continues to see impressive growth with 2016 experiencing a 12% spike.
With advertisers spending £4.5m every day on affiliate sales, leads and other activity broadly defined by performance metrics, the latest data from the UK suggests affiliate marketing growth has quickened in the past 12 months.
The Online Performance Marketing Study (OPM) is conducted by the Internet Advertising Bureau in conjunction with PwC each year and 2016’s numbers indicate a double digit jump on the previous year, with lead generation’s year-on-year performance outstripping affiliates.
But beyond the top line numbers what other insights can we glean about the state of the performance industry in 2017?
Top level insights
When the OPM is published invariably most attention is focused on the big numbers, the overall scale of the lead generation and affiliate markets. It’s worth noting that while these channels are the primary coverage for the Study, it also takes account of wider ranging activity that is broadly defined by its focus on return on investment. Price comparison and meta-search partners, active in the service and travel industries, are also included.
When all of that data, some of it submitted, other elements modelled and estimated, is aggregated the following picture emerges:
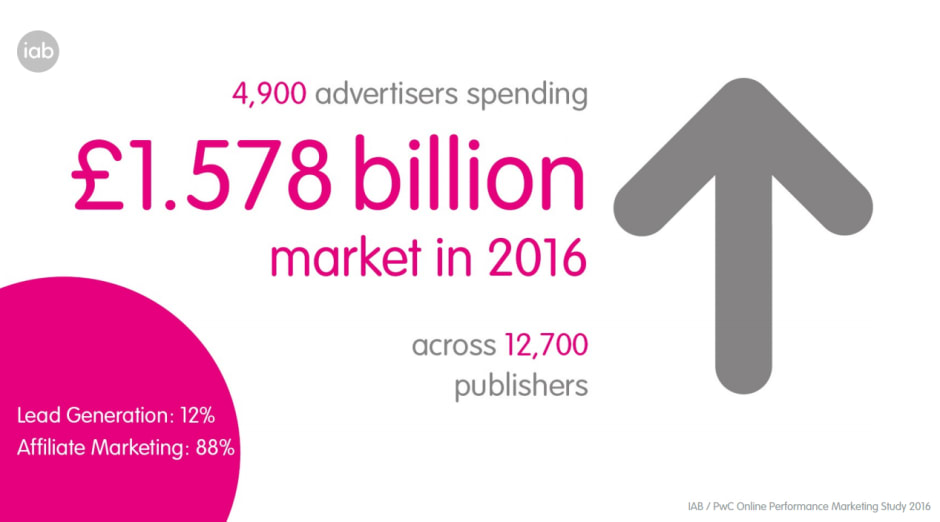
- There are 4,900 advertiser campaigns in the UK
- Those advertisers spent almost £1.6bn on generating sales
- 88% of this was broadly defined as affiliate activity, with lead generation accounting for the other 12%
- Active publishers earning commissions crept closer to the 13,000 mark
- Year-on-year growth was 12% with lead generation growing at twice the rate of affiliate
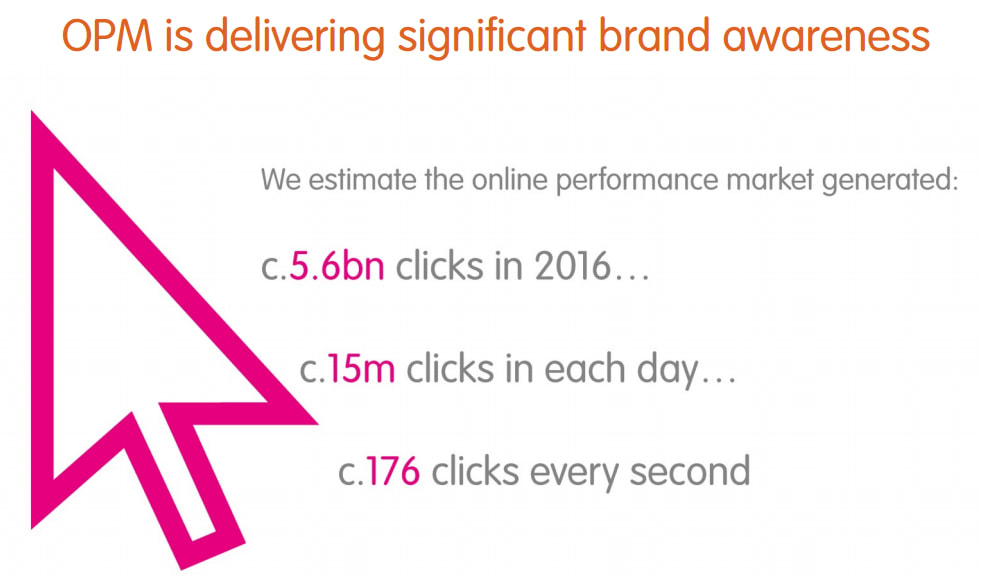
- 6bn clicks converted into 171m transactions and leads (73% affiliate)
- £19.4bn in sales revenue generated for advertisers (representing a 16% year-on-year hike)
- Dividing the revenue by advertiser expenditure results in an ROI of £12.30 for every £ spent (this would have been a drop from 2015 figures but last year’s data has been remodelled which revised downwards 2015’s ROI outcome)
- OPM represents around 8-10% of UK digital spend, 8% of UK retail ecommerce and 1% of the UK’s GDP
Delving into the numbers
So what should we interpret from these impressive headline statistics? Firstly the market is continuing to grow. There was a fear that 2016’s numbers could stagnate after impressive exponential growth since the channel’s inception. There has been significant discussion about advertisers both cutting commissions and squeezing margins.
While this is a broad trend that has been spotted in certain quarters, it hasn’t manifestly led to a leap in the ROI delivered by the channel, which would be expected by such a move. It is worth noting that traditional (some would say pure) affiliate revenue accounts for a minority of the data captured by OPM, so is any such development had occurred, it would ultimately be masked to some degree.
Encouragingly the number of sale active publishers and live advertiser programmes increased after remaining static for the past few years. These are numbers that are difficult to read and conservative in estimate (which ultimately they are for fear of double accounting). 13,000 sale active publishers may sound impressive but is an area that needs collective work by the industry.
We have a joint responsibility to both convert dormant publishers into generate revenue ones, while growing the overall pool. In the interests of brevity the ways to do this can’t be discussed here but identifying how to mould influencer marketing to the CPA channel while devising innovative payment solutions is one area that needs to be explored.
Finally a quick nod to the lead generation industry. Often a footnote in the OPM study, the more than 20% leap in leads tracked represents a spike that outstripped affiliate as well as many other digital disciplines.
Additional insights
Smartphone expenditure rose 23% year-on-year to account for one in six sales. This is pretty much in line with Awin’s numbers albeit under-indexing digital in general. There are significant variations in the data depending on sector and demographic so when averaged out the percentages are not necessarily reflective of many of the major affiliate programmes.
Finally it’s worth noting the OPM depends on industry supporting it. In 2013 27 companies submitted their data to PwC for scrutiny. This time around that number had halved to just 13. Some major contributors to the study were missing and while their numbers can be modelled from published financial reports it is a worrying and downward trend.
UK performance marketers need to consider the OPM Study is the only one of its kind in the world and respected across the world. If fewer and fewer companies support it then it tarnishes its effectiveness. It’s worth noting that companies that are not members of the IAB can submit their numbers. 2017’s numbers will be collected at the start of next year.
For more details on this year's OPM and the wider IAB Adspend report click here.