Has Singles' Day become a fixture in the UK?
5 minute read

Singles Day in China was bigger than the projected e-commerce sales for the entirety of Brazil in 2016. This is just one of the many eye watering stats to come from another record breaking day of activity in China.
Falling on 11th November, it is the single biggest shopping day in the world. 2015 saw a record breaking day with $14.3bn spent. This total was exceeded by 8pm this year according to Tech Crunch. The final figure reported for the day’s trading stood at a staggering $17.8bn.
Last year saw UK retailers starting to benefit from Chinese consumer activity for the first time. Following the result of the UK’s decision to leave the European Union and the subsequent drop in value of the pound, it was widely anticipated that UK retailers would benefit further from Chinese activity. So how did it fare this year?
Sales from China
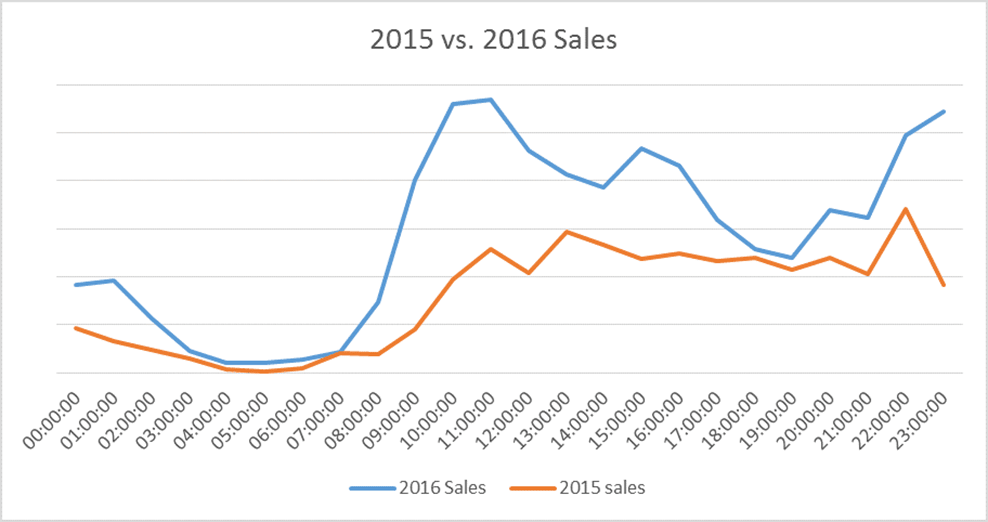
The chart below plots sales for UK advertisers from China across the day (times converted to reflect a 24 hour period in China).
It is clear to see that 2016 out performed 2015 throughout the day with a clear spike in activity from 8am. Infact the network saw an 84% increase in sales compared to 2016.
Sales saw an additional peak towards the end of the day as consumers flocked to secure the best deals before the day was out.
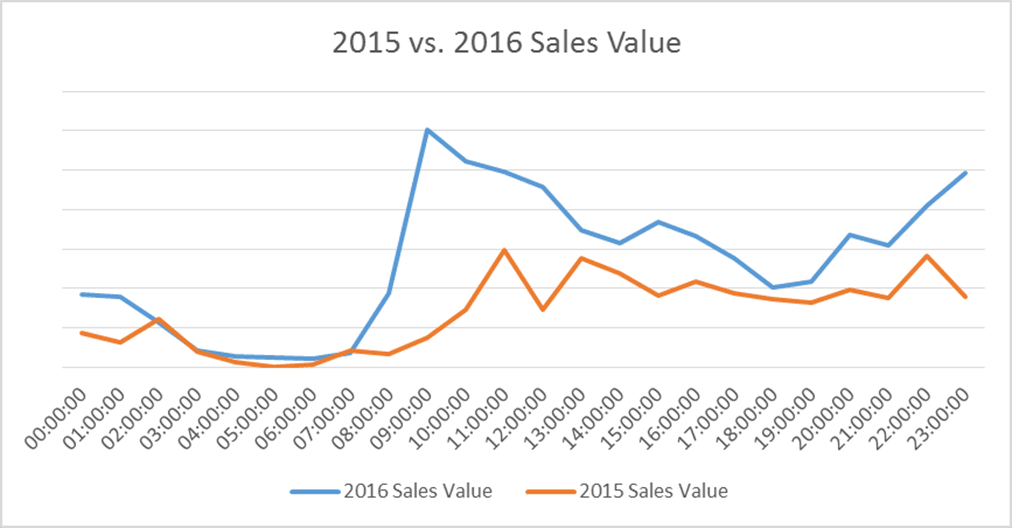
Sales Revenue from China
Sales revenue generated by UK advertisers shows a similar pattern throughout the day. While it took until 8pm for sales in China to exceed the totals witnessed for 2015, UK advertisers on the network had reached that milestone by 2pm. This is indicative that UK advertisers were well positioned to take advantage of additional activity from China this year.
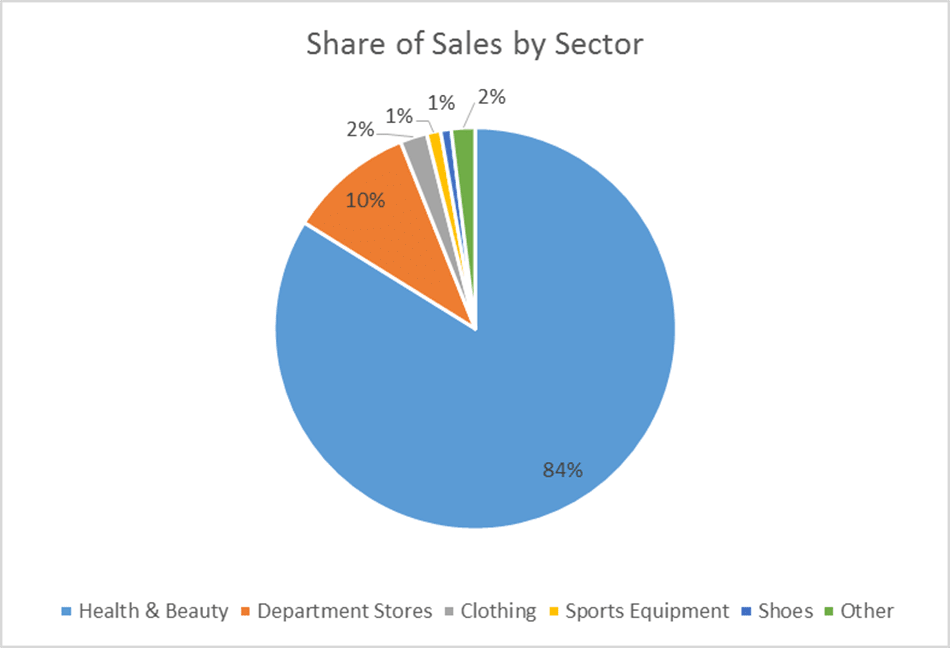
Top performing sectors
Looking at the sectors driving this activity there is a clear trend. There is significant appetite for health and beauty products from Chinese consumers. 84% of all transactions from China on singles day were within this sector.
Department stores was the next most popular sector with 10% of transactions across the day.
Growth vs. the previous week
In order to determine whether or not Singles Day is responsible for driving this growth from China, comparing sales from this region to the week before Singles Day gives us a good indication of this.
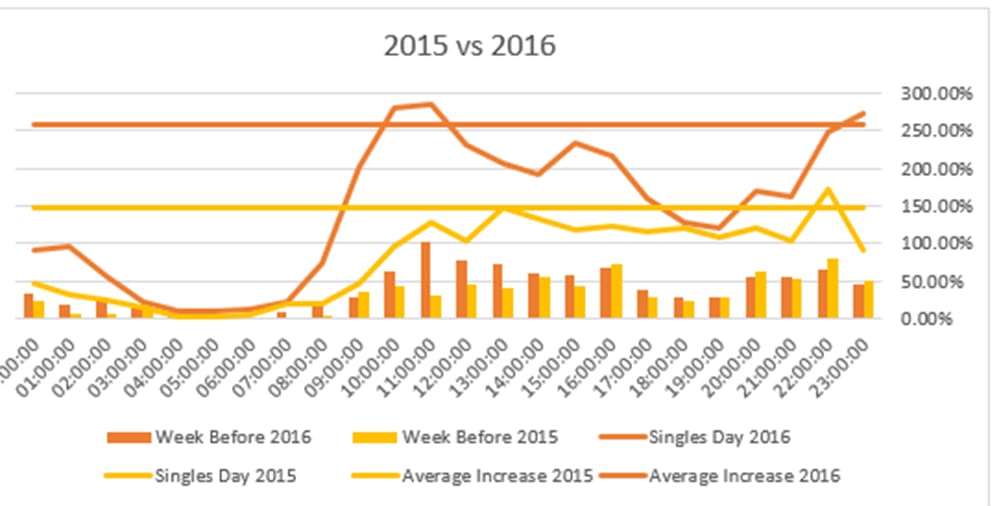
The chart below looks at the sales generated in China on Singles Day in 2015 and 2016 and the sales from China in the week preceding Singles Day. The bars represent the week before while the line chart is Singles Day.
The percentage growth from Singles Day vs. the week before is also plotted (in the constant line) to showcase this. 2016 saw 250% growth from the previous week, while for 2015 this growth was 150%
This is indicative that demand for products from UK advertisers has increased and Singles Day has been influential in driving this growth.
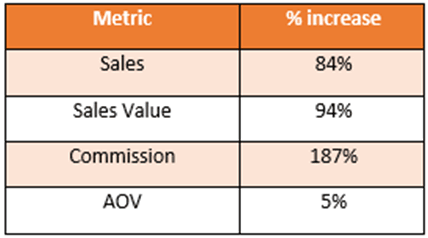
The table below shows the uplift in activity on Singles Day 2016 vs. 2015. Not only were consumers purchasing more, they were also spending more when they did. Average order values (AOV) was up 5% on 2015. With Chinese consumers getting more value for their money, they were keen to take advantage.
The increase in commission is indicative of advertisers securing additional coverage across their key partners to boost activity at this key trading time.
Is singles day an event for UK retailers outside of China?
Having seen impressive growth from China, is Singles Day also resonating with consumers outside of China?
The chart below looks at sales across the network for UK advertisers on Singles Day 2015 vs. 2016. The trends throughout the day experience an almost identical pattern, yet it is evident that there was more demand this year.
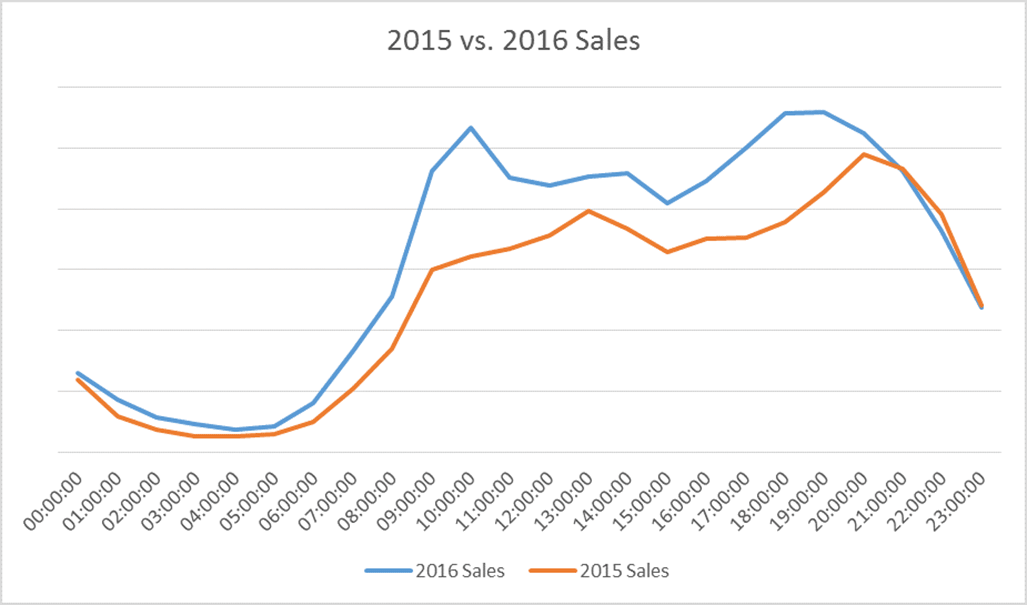
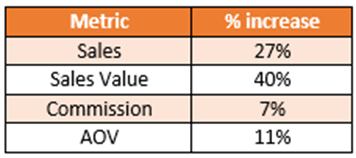
Again, each of the key metrics looked at demonstrated growth vs. last year. While the growth figures aren’t as impressive, they are certainly evident:
Is this growth fuelled by Singles Day or Growth across the network?
As with the data for China, it is important to understand if the growth has been driven by Singles Day specifically, or if it is general growth that has been seen across the network.
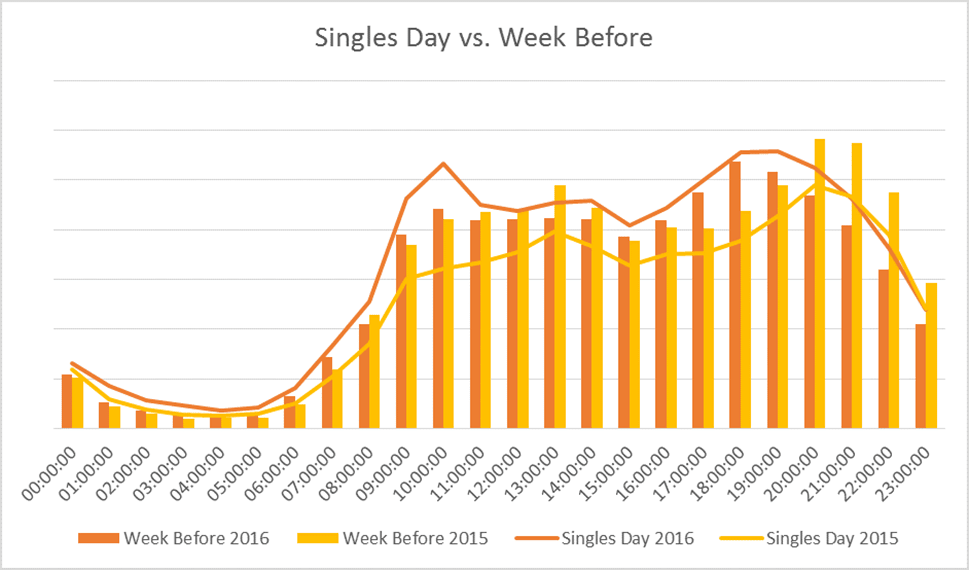
The chart below plots Singles Day against the week prior to Singles Day. From this there is no evidence of Singles Day having a big impact across the network. In fact in 2015 the week before Singles Day was actually larger itself.
So what we are seeing is Singles Day has a significant impact on a selection of advertisers within certain sectors who are poised to take advantage of regional consumer desires.
Advertisers with the infrastructure to facilitate international delivery are well positioned to take advantage of this growing trend.
Should UK advertisers look to benefit further from Singles Day from a UK perspective?
It is evident that Singles Day is not currently resonating with a UK audience. This could be down to a lack of awareness amongst consumers, or advertisers not having the offers in place to encourage consumer spending on Singles Day.
While Singles Day is the largest one day sales event across the globe, the key event in the UK shopping calendar is Black Friday. Falling on the 25th November, advertisers are busy preparing their offers to take advantage.
Singles Day is unlikely to catch up with Black Friday from a UK perspective any time soon, but there is clearly an appetite from Chinese Consumers for UK products.
Advertisers should certainly be looking to focus their efforts on this market to take advantage of their shopping habits.